Software Engineering Diagrams for Your Next Projects
Table of Contents
Introduction
Software engineering is the systematic process of designing, developing, testing, and maintaining software applications to meet user requirements. To effectively communicate and understand complex software systems, software engineers rely on a variety of diagrams. These visual representations serve as blueprints, aiding in design, development, and overall project comprehension.
Understanding Common Software Engineering Diagrams
Software engineering diagrams can be categorized based on their purpose. Let’s explore some of the most commonly used diagram types.
Process Flow Diagrams
Flowcharts: A flowchart is a visual representation that illustrates the sequence of steps or processes involved in a task. It uses symbols like rectangles, ovals, diamonds, and arrows to represent different actions and decision points. Flowcharts are invaluable for understanding and documenting system processes, from start to finish.
- Example: The flowchart below outline the steps involved in a user registration process, from inputting details to account activation.
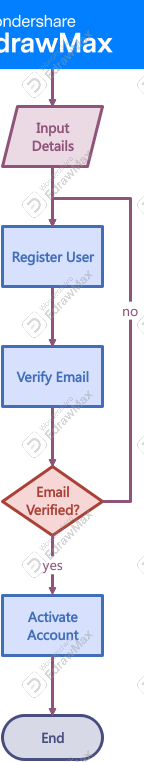
- Example: The flowchart below outline the steps involved in a user registration process, from inputting details to account activation.
Sequence Diagrams: Sequence diagrams focus on the interactions between objects or components over time. They show the order of message passing and method calls, helping to visualize the flow of control.
- Example: A sequence diagram below depict how a user and a ticket booking system interact in booking a seat.
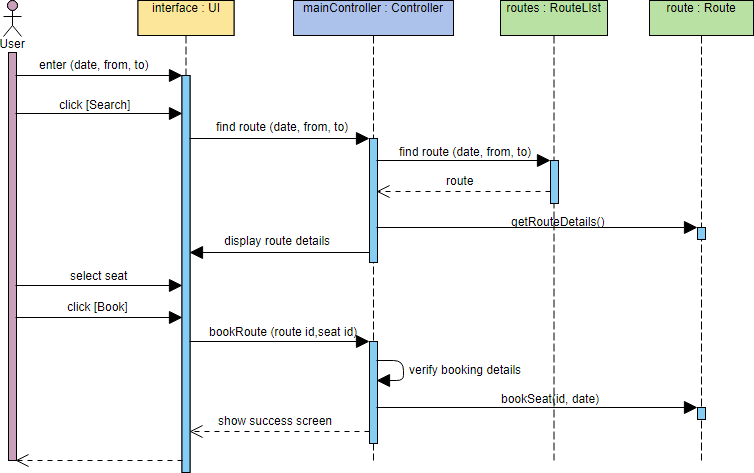
Image from online.visual-paradigm
- Example: A sequence diagram below depict how a user and a ticket booking system interact in booking a seat.
Data Modeling Diagrams
Data Flow Diagrams (DFDs): DFDs illustrate the movement of data through a system. They show how data enters a system, how it is transformed, and how it exits. DFDs are essential for understanding system inputs, outputs, and processes.
- Example: The example data flow diagram below display the process of student registration for courses. It’s outline the flow of data between the entities involved in the process.
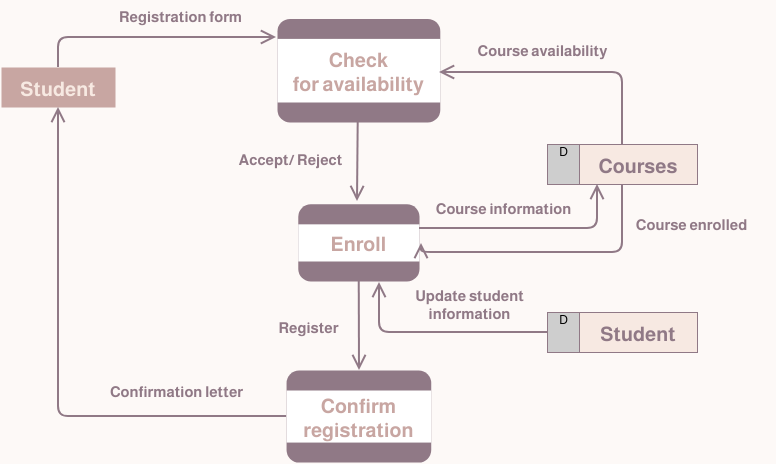
Image from online.visual-paradigm
Entity-Relationship (ER) Diagrams: ER diagrams model the structure of a database by representing entities (people, places, things) and their relationships. They are used in database design to visualize data entities and how they are connected.
- Example: The ER diagram below models a university database outlining entities like Departments, Instructors, Courses and Students along with their attributes and relationships
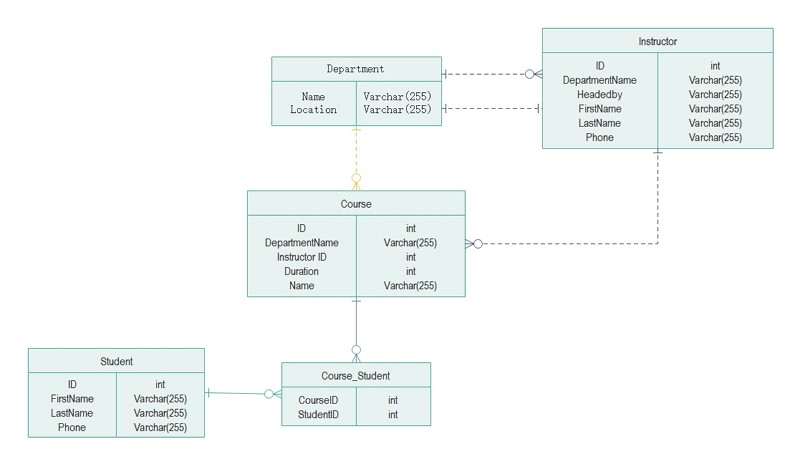
Image from Edrawmax
Structural Diagrams
UML Class Diagrams: Class diagrams are used in object-oriented design to represent the classes, attributes, and relationships within a system. They provide a static view of the system’s structure.
- Example: A class diagram for a bank ATM system which show classes like ATM Transactions, Customer, Bank, etc along with their attributes and relationships.
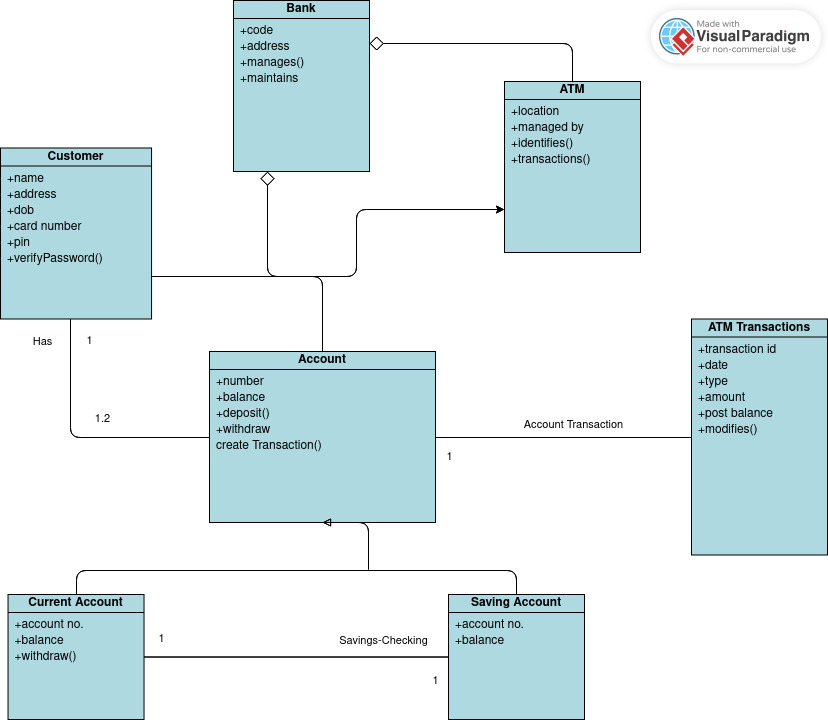
Image from online.visual-paradigm
System Diagrams: System diagrams provide a high-level overview of a system, showing its components and their interactions. They are useful for understanding the overall architecture of a system.
- Example: The system diagram illustrates the process where patients and doctor interact through the application system to order and manage medications.
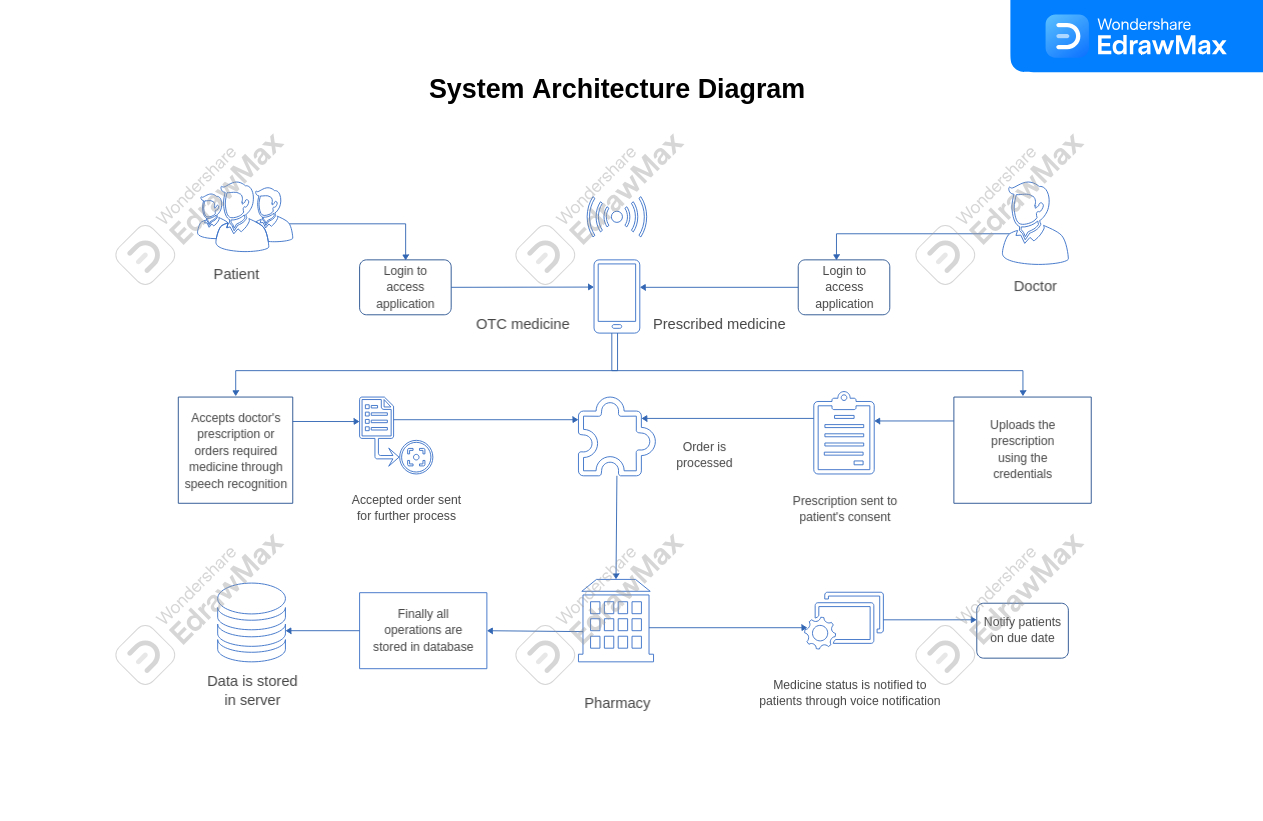
Image credit by Airone Kheji Alix from Edraw templates
Benefits for Leveraging Software Engineering Diagrams
- Clear Communication: Diagrams serve as a visual language, making complex concepts easier to understand for collaborators whether technical or non-technical ones.
- Onboarding New Contributors: Well-crafted diagrams help in the onboarding process by providing a clear overview of the project’s structure and workflow.
- Code Maintainability: Software diagrams help document design decisions and make it easier for developers to understand and modify software codebase over time.
Conclusion
Software engineering diagrams are indispensable tools for visualizing and communicating complex software systems. By effectively utilizing these diagrams, software engineers can improve design, development, and overall project efficiency. While this blog has introduced several common diagram types, it’s essential to explore the diagram(s) you are interested with in more depth to fully grasp the potentials.
Resourses and Tools
- Visual Paradgim - Online Productivity Suite(Diagram Maker): An online tool that allows user to create everything diagrams and process maps.
- EdrawMax: It’s a powerful online software service for all things diagramming, from professional flowcharts, org charts, engineering designs etc.
- Lucidchart: It’s a web-based diagramming app that allows users to visually collaborate on drawin and sharing of diagrams.